
Flowchart
Flowchart is a diagrammatic representation of sequence of logical steps of a program. Flowcharts use simple geometric shapes to depict processes and arrows to show relationships and process/data flow.
Introduce Flowchart Shapes
When teaching how to make a flowchart it is important to explain that shapes have meaning. These symbols are standard. For example, an oval is used to illustrate the start and end of a program, whereas a diamond shows a decision such as yes or no.

Use an oval to mark the beginning and end of the program.

Use a parallelogram to show input or output. Input could be the user entering information. Output could be a message on the screen.
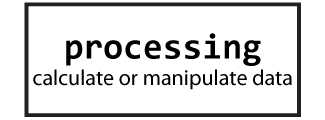
Use a rectangle to process an action. It could be a formula to calculate a value, or it might be a step that modifies text.

Use a diamond to make decisions. This shape will have two or more lines that come from it – one for each outcome. This step might ask a question or provide options. The result could be true or false, yes or no, or choices (red, blue, or green).

Use lines to connect the shapes. The arrows show the direction of the steps. Some lines should include labels, such as yes or no, to explain what is happening.
Advantages of Flowchart:
- Flowcharts are better way of communicating the logic of system.
- Flowcharts act as a guide for blueprint during program designed.
- Flowcharts helps in debugging process.
- With the help of flowcharts programs can be easily analyzed.
- It provides better documentation.
- Flowcharts serve as a good proper documentation.
Disadvantages of Flowchart:
- It is difficult to draw flowchart for large and complex programs.
- In this their is no standard to determine the amount of detail.
- Difficult to reproduce the flowcharts.
- It is very difficult to modify the Flowchart.


0 Comments